
Date:
Tuesday, 15 October 2019 - 3:45pm
Category:
Latest Projects
Country:
Australia
Selecting the most appropriate cushion geotextile is an integral part of a lining system.
If the cushion geotextile is ineffective, the likelihood of the primary liner (typically geomembrane) being damaged increases (in the short term) and if the primary liner is a HDPE geomembrane, then strain induced stress cracking could occur in the long term.
Designing and building a lining system with the lowest probability of leakage over time is what we’re trying to achieve and so engineering methods to limit this is crucial.
A number of desktop methods are available to determine an appropriate cushion geotextile, and from there a manufacturer’s technical data sheets are often consulted to determine the appropriate properties to include in a specification.
But how accurate are these methods?
Do we know how well they perform in cushion protection functions?
CBR Burst Strength and Puncture Resistance index test properties indicate that with an increase in cushion geotextile mass there is a correlation with resistance to short term damage, but these values cannot be used to quantify long term cushion performance and the required level of reduction in strain on the lining system.
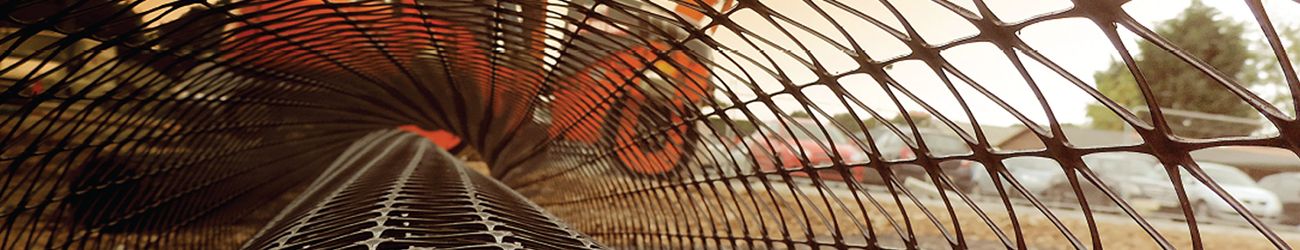
What has become much more common place across project specifications is Protection Efficiency Testing (or commonly named Pizza Testing due to the aggregate ‘pizza’ look and the test equipment resembling a pizza oven – see Figures 1 and 2 below).
This test involves replicating elements of the lining system and determines the maximum strain placed on the geomembrane liner using project specific design inputs.

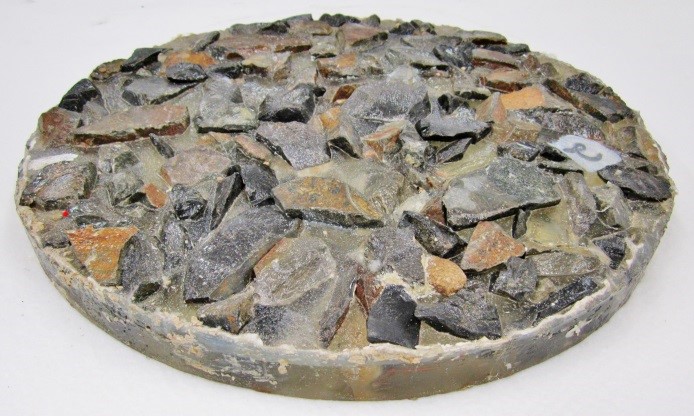
Geomembrane protection efficiency testing is carried out in accordance with ASTM D5514 – Standard Test Method for Large Scale Hydrostatic Puncture Testing of Geosynthetics, modified to include the use of a fixed stone profile and 3D laser surface profilometry (LSP).
This modification to a fixed stone profile is critical to ensure multiple tests undertaken are identical. If the maximum strain determined is undesirable, the geotextile grade can be amended whilst leaving all other variables the same.
NB - if the stone profile is not fixed, then the stone orientation will be different for every test, thereby adding increased variability to the analysis.
The stone profile is placed into the test rig followed by a layer of the proposed protection geotextile, a 0.3 mm aluminium strain indicator sheet and the proposed geomembrane (Figure 3).

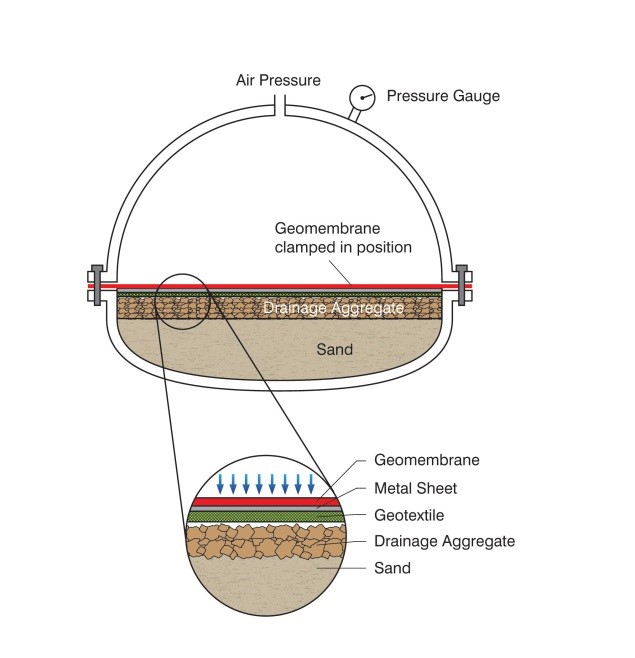
The test equipment uses pneumatic pressure to force the geomembrane onto the aluminium strain indicator sheet, protection geotextile and rock profile, up to the required design load.
After the application of the target load, the aluminium strain indicator sheet is sent for laser scanning where geomembrane strain and strain distribution are calculated, and a contour plot is generated (Figure 4).
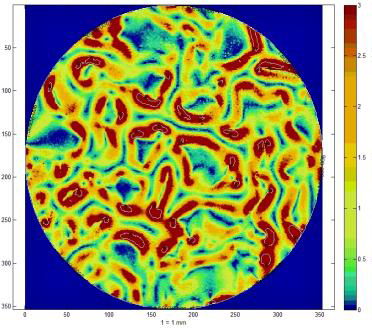
LASER SURFACE PROFILOMETRY
Laser surface profilometry is a quick and repeatable method of strain analysis allowing the whole surface of the geomembrane to be assessed, rather than relying on visual pre-selection of the highest strain regions of the geomembrane as with other methods. The scanned area is then divided into a 1 mm x 1 mm grid layout.
The average height of all the points within the individual 1 mm x 1 mm cell is used to define the final height of the cell. The strain is calculated by assessing the relative height difference between the central cell and the eight neighbouring cells.
This procedure is repeated for every 1 mm x 1 mm cell across the 350 mm diameter scanned area (96,211 mm2). The maximum strain between the central cell and any of the neighbouring cells is recorded as the strain for that cell area.
Specific software was developed to analyse the strain between the 96,211 points. When the metal sheet is scanned, all points are assigned an x, y and z coordinate with z defining the height of the point. The strain between any two points is calculated using the distance between the original length and the deformed length.
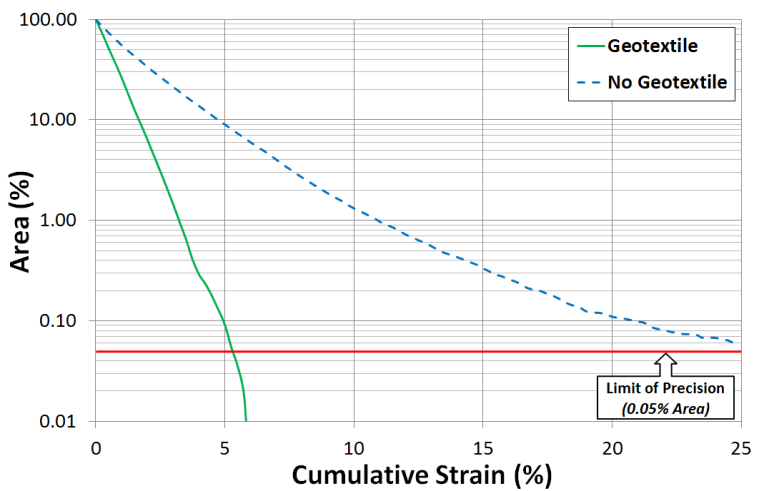
Once all cells are assigned a strain value, these are then categorised in terms of percentage of the total area falling within certain strain ranges in 0.25% increments from 0 to 25%. This data is then presented in a cumulative form on a graph showing the area (%) vs cumulative strain (%) where 100% of the area represents zero strain.
The limit of precision of the scanning equipment used by Geofabrics is reached at 0.05% area. The maximum strain value is taken at the intersection of these lines (Figure 5).
INFLUENCE OF GEOTEXTILE TYPE
Mass and thickness are often used as the sole specification parameters for protection geotextiles. This has proven erroneous particularly when backed by Protection Efficiency testing.
Geofabrics, being an Australian manufacturer of two different families of non-woven geotextiles, have undertaken extensive research (internal and with external research partners) on a range of different types and compositions of nonwoven geotextiles to understand the differences in performance.
This research has repeatedly proven that mass and thickness parameters for a cushion geotextile alone are not enough to make a precise assessment of geomembrane strain.
Figure 6 shows a combined set of results for the four main “families” of nonwoven geotextile types offered in the ANZ market:
1. CF PET - Continuous Filament Polyester nonwoven geotextile
2. CF PP - Continuous Filament Polypropylene nonwoven geotextile
3. SF PP - Staple Fibre Polypropylene nonwoven geotextile
4. SF PET - Staple Fibre Polyester nonwoven geotextile
As shown in Figure 6, if the strain values for a given geotextile mass are compared at 800 g/m2, it is apparent that continuous filament, polyester geotextiles (such as Bidim®) outperforms both the continuous filament polypropylene as well as all of the staple fibre geotextiles.
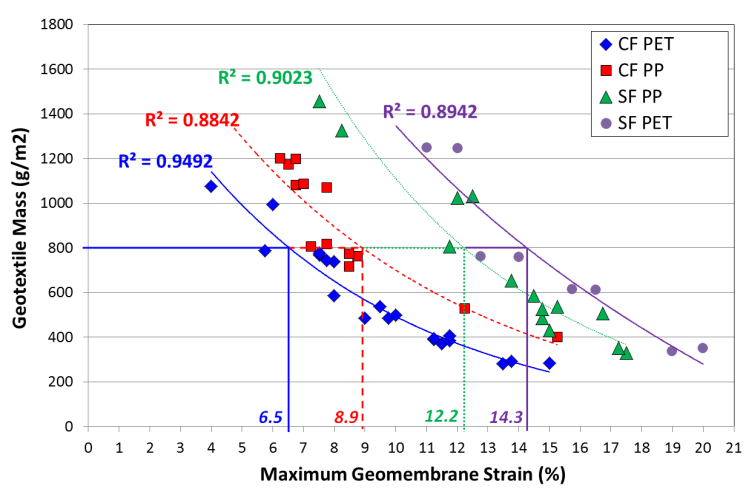
Similar trends to those shown on Figure 6 occur if CBR or Thickness is substituted for geotextile mass, with the continuous filament, polyester nonwoven geotextile always outperforming the other three types of geotextiles, resulting in lower strain on a like-for like control parameter basis.
EXAMPLE
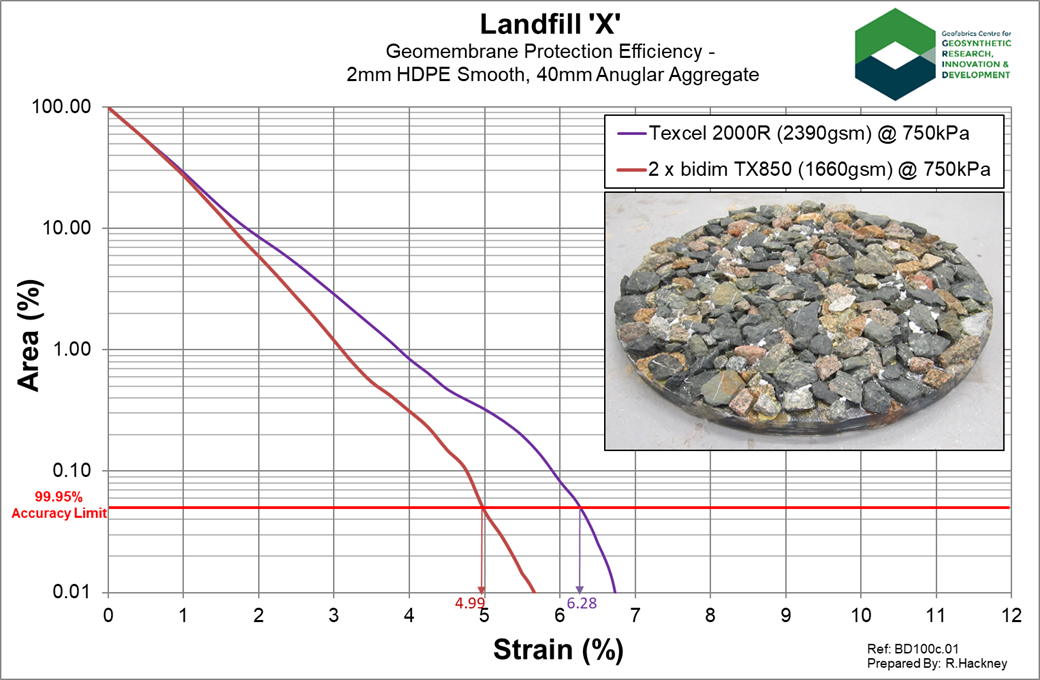
A recent landfill was being designed with a maximum required strain of 6% under high load (750 kPa) and with an aggressive drainage aggregate profile.
Geofabrics tested two different options for the designer to help them optimise their design –
- A single heavy-weight layer of Texcel 200R with a specimen mass of 2,390 gsm
- Two layers of bidim TX850 with a combined specimen mass of 1,660 gsm
The results below in Figure 7 show the two layers of bidim TX850 provided a lower strain on the membrane despite being lower mass – showcasing the performance of bidim as a world-class cushion geotextile.
Where contractors want to reduce the installation sequences, Geofabrics has been laminating two layers of heavy-weight cushion geotextile together, thereby allowing the high-performing cushion geotextile layer to be installed in a single process, reducing installation time.
The cushion geotextile was further enhanced by the specification of needle-free geotextile – easily accommodated by the right technology in the manufacturing process. Geofabrics internally defines “needle-free” as being no more than 1 mm2 of metal in the entire roll, and these rolls are then labelled with NF as the end of the product code.
CONCLUSION
From the above, we can conclude that thickness and CBR alone are not a good basis for the specification of a protection geotextile.
With a library of cushion testing over the past decade, Geofabrics can show the different protection efficiency performance of different geotextiles with different stone profiles under different loads on different membranes.
But – a word of caution – every geotextile producer makes their geotextile slightly differently with different polymer sources, so even within the CF PET “family”, it is still important to understand the performance of each geotextile offered. This is why there are many commercial laboratories in Australia that offer stone pizza testing prior to the specification of the aggregate, cushion geotextile and geomembrane.
We believe Bidim® is the highest performing cushion geotextile. But don’t believe us - test in a Pizza Test to see for yourself.
Related News
Thursday, 23 March 2017 - 6:30pm
Tuesday, 18 July 2017 - 3:30pm
Related Products
Related Sectors
